1. Introduction
- 投资者情绪等指数对石油价格(收益率)的预测(or predictability);如投资者看涨、看跌的情绪.
- 投资者关注度。如对石油市场的关注度(可以借助谷歌指数)、对石油政策、绿色消费、碳中和等的关注度等;
- 基于数据挖掘对石油价格的预测。挖掘一些新的创意点对油价进行预测,初步拟定爬取新闻文本,之后借助自然语言处理分析投资者情绪,情感分析,投资者关注度等。
虽然研究的是油价预测,但油价其实只是一个载体,换成其他的商品处理逻辑也差不多,只是因为课题是能源金融,需要一个载体来契合这个点。
2. Methodology
- 可使用的工具:
- 爬虫: 多线程和多进程爬重
- 机器学习:
SVM,Lasso,Random Forest,LightGBM; - 深度学习:
CNN NLP: Text classification, Sentiment analysis, Topic modelling.
3. Text mining
3.1 Get news information
3.1.1 爬取信息
参考 Wu et al.,我们也选择 OilPrice.com 的 ARTICLE ARCHIVE | PAGE 1 部分的所有新闻,作为我们的新闻来源,我们借助 Python 爬虫工具从该栏目中爬取了 1300 页,每页有 20 条新闻,合计 26000 条新闻。
爬虫分两步:
利用多线程爬虫(
threading) 爬取所有新闻的链接最终,得到了总计 26000 条新闻的所有链接。
利用多进程爬虫 (
multiprocessing) 爬取所有新闻的内容由于数据量过于庞大,要对总计 26000 条新闻链接进行访问和获取包含标题、发布时间、作者、新闻内容在内所有信息,因此如果一条条的进行爬取的话,会非常耗时。因此,此处借助多
CPU的优点,选择使用多进程multiprocessing爬虫进行处理。此外,由于个人电脑的
CPU数量并不多,Google Colab平台的CPU数为 2,综合考虑之后,此处使用阿里云平台的 Data Science Workshop 进行处理,因为其CPU数为 24。最终得到 25695 条新闻数据的全部文本内容。
3.2 News propression
3.2.1 Text cleaning
First of all, we need process data cleaning.
- Load news content and and remove the data outside the time frame of our study.
- Turn the Time columns (string) to timetype.
- Extract the daily and hourly information for further analysis.
Finally we get 24308 news, each item contains nine columns:
- Link: Links to articles;
- No: Counter;
- Content: full content of articles;
- Title
- Author
- Time: Posted time
- Date: daily information
- Hour: Post hour
- H-M-S: hour-minute-second
The last five items are show in Table 1:
| Link | No | Content | Title | Author | Time | Date | Hour | H-M-S | |
|---|---|---|---|---|---|---|---|---|---|
| 24303 | https://oilprice.com/Energy/Energy-General/Exx... | 81 | Higher oil and gas demand and the best-ever qu... | ExxonMobil Beats Earnings Estimates As Its Che... | Tsvetana Paraskova | 2021-07-30 09:00:00 | 2021-07-30 | 9 | 09:00:00 |
| 24304 | https://oilprice.com/Energy/Natural-Gas/Natura... | 80 | Natural gas prices are rising across Europe an... | Natural Gas Deficit Causes Prices To Soar | Irina Slav | 2021-07-30 10:00:00 | 2021-07-30 | 10 | 10:00:00 |
| 24305 | https://oilprice.com/Energy/Oil-Prices/Analyst... | 79 | Oil analysts and economists believe that $70 a... | Analysts See Oil Trading Closer To $70 Through... | Tsvetana Paraskova | 2021-07-30 11:00:00 | 2021-07-30 | 11 | 11:00:00 |
| 24306 | https://oilprice.com/Energy/Energy-General/US-... | 78 | The number of oil and gas rigs in the United S... | U.S. Oil Rig Count Slips Amid Drop In U.S. Oil... | Julianne Geiger | 2021-07-30 12:11:00 | 2021-07-30 | 12 | 12:11:00 |
| 24307 | https://oilprice.com/Energy/Energy-General/Oil... | 77 | Oil prices climbed this week as U.S. inventori... | Oil Bulls Remain Confident Despite Covid Concerns | Tom Kool | 2021-07-30 14:00:00 | 2021-07-30 | 14 | 14:00:00 |
3.2.2 Load oil price
We use WTI future oil price (collecte from Wind database) as the movement index, from 2011.8.1 to 2021.07.30 (7.31 is also non-trading day), 10 years and 2545 samples in total, six samples see Table 2.
| Date | Price | Movement | |
|---|---|---|---|
| 2539 | 2021-07-23 | 72.07 | 1 |
| 2540 | 2021-07-26 | 71.91 | -1 |
| 2541 | 2021-07-27 | 71.65 | -1 |
| 2542 | 2021-07-28 | 72.39 | 1 |
| 2543 | 2021-07-29 | 73.62 | 1 |
| 2544 | 2021-07-30 | 73.95 | 1 |
3.2.3 Preparation
Before carrying out sentiment analysis, we need preprocess the original data. Considering that news information can be published in either trading days or non-trading days, and also can be published in either trading hours or non-trading hours, we need to preprocess the attribution date of news. The specific processing rules are as follows:
- News posted before 17:00 on the same day is classified as the news of the trading day
- The news released after 17:00 on the day is classified as the news of the next trading day
More details see Fig. 1:
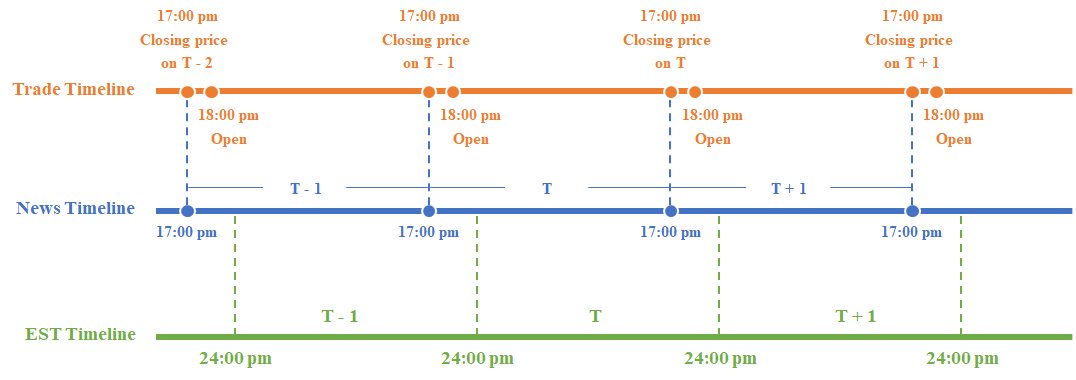
Note: This guide describes the news timeline. Considering that the closing/opening time of WTI future oil price is 17:00/18:00 pm EST, so we regard news form 18:00 pm (the T-1 -th day) to 17:00 pm (the T-th day) as news posted on T-th, and the use these news (features information extracted by deep learning technique) to predict oil prices.
Analysis with merged data
1 | The total number of days news was issued: 3358 |
From above, we can see that all of 24308 news were issued in 3358 days among 10 years. In total, there are 4274 news posted on non-trading days. Then, we need to:
Classify these news to news trading days.
Classify news according to posted hours. If a news is posted after 17:00 PM, we consider to regard this news as next day’s news
3.3 Sentiment analysis with FinBERT
3.3.1 Introduction
FinBERT is a pre-trained NLP model to analyze sentiment of financial text. It is built by further training the BERT language model in the finance domain, using a large financial corpus and thereby fine-tuning it for financial sentiment classification. Financial PhraseBank by Malo et al. (2014) is used for fine-tuning. For more details, please see the paper FinBERT: Financial Sentiment Analysis with Pre-trained Language Models and related blog post on Medium.
In this subsection, we ultilize the Hosted inference API and Github project to analysis the sentiment characteristics hidden in the news text.
Data exploration to Financial PhraseBank
Financial Phrasebank (Malo et al. (2014)) consists of 4845 english sentences selected randomly from financial news found on LexisNexis database. These sentences then were annotated by 16 people with background in finance and business. The annotators were asked to give labels according to how they think the information in the sentence might affect the mentioned company stock price. The dataset also includes information regarding the agreement levels on sentences among
annotators.
Note: Please make sure to abid by the license and copyright for the use of the data. Please check with the author.
Download the data from this link and unzip it under finphrase_dir set above.
Data information
1
2
3Total number of record in the file: 4846
Total number of record after dropping duplicates: 4840
Missing label: 0Some samples see Table 3:
Table 3 Some examples in Financial Phrasebank corpus sentence label 3200 The company serves customers in various industries , including process and resources , industrial machinery , architecture , building , construction , electrical , transportation , electronics , chemical , petrochemical , energy , and information technology , as well as catering and households . neutral 2527 Officials did not disclose the contract value . neutral 4101 The extracted filtrates are very high in clarity while the dried filter cakes meet required transport moisture limits (TMLs)for their ore grades . neutral 1926 The tool is a patent pending design that allows consumers to lay out their entire project on a removable plate using multiple clear stamps of any kind . neutral 1536 In Finland , the corresponding service is Alma Media 's Etuovi.com , Finland 's most popular and best known nationwide online service for home and property sales . neutral Histogram
From Fig. 2, we find that more than 60% of the data are labeled as “neutral”. Sometimes imbalanced data are balanced using methods like resampling (oversampling, under-sampling) as models tend to predict the majority class more. SMOTE or the Synthetic Minority Over-sampling Technique is a popular technique for oversampling but it is a statistical method for numerical data.
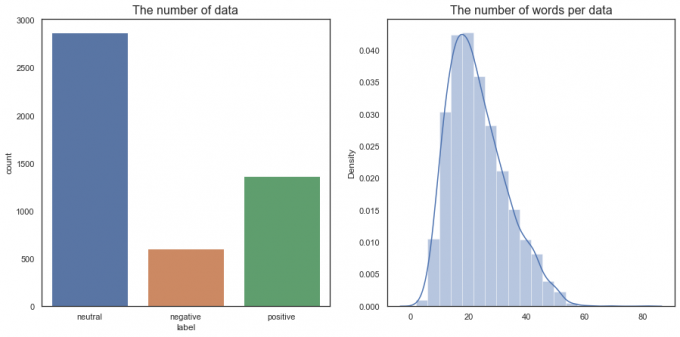
Fig.2 The word distribution of Financial PhraseBank In addition, this imbalance should be also taken into consideration if this happends in the real world.
Word frequency
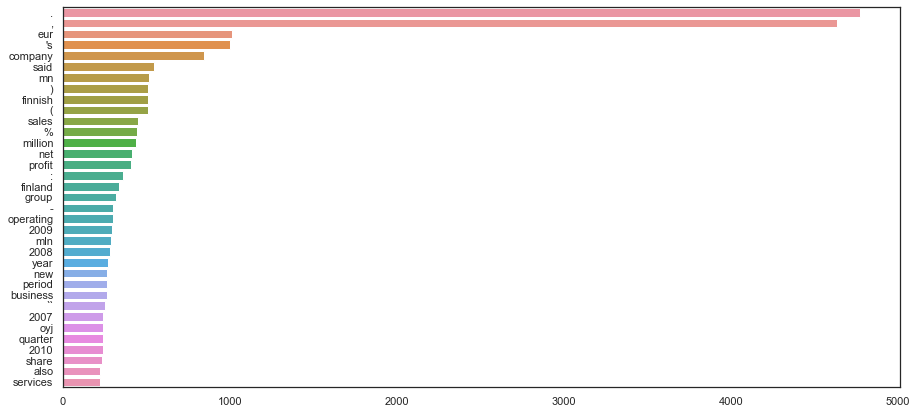
Fig.3 The word frequency of Financial PhraseBank Word cloud

Fig.4 The wordcloud of Financial PhraseBank
3.3.2 Load pre-trained model
- Download FinBert model
- Load dependency files
Test:
Table 4 Two test for FinBERT model sentence logit prediction sentiment_score 0 Stock prices will continue to rise over the ne... [0.84775513, 0.08607003, 0.066174865] positive 0.761685 1 Stock prices will continue to fall over the ne... [0.0089766085, 0.9678817, 0.023141773] negative -0.958905 Note:
- Because some of the original code didn’t fit perfectly in our prediction work, hence, we made some changes to the source code.
- The initial prediction function did not support input lists of strings (as shown in the following examples), so we made some changes to the original code.
3.3.3 Analysis sentiment features
In this part, we perform sentiment analysis for both news headlines and news bodies, and the output results include five parts:
- Senti: sentiment score, obatain by subtracting negative prob. from positive prob. (title and full-text)
- Prediction: this item is considered
Positive,neutralornegativeby the FinBert (title and full-text).
3.4 Subjective analysis with TextBlob
3.4.1 Introduction
TextBlob is a Python library for processing textual data. It provides a simple API for diving into common natural language processing (NLP) tasks such as part-of-speech tagging, noun phrase extraction, sentiment analysis, classification, translation, and more. Many scholars used this library to perform textual sentiment analysis, such as, Li et al., Bai et al..
However, the sentiment analyzers of TextBlod is the Naive Bayes classifier on the movie review corpus. We know that there are certain ambiguities in language expressions in different fields. Our research fields are finance and economics, so there may be some errors in using this classifier. Therefore, we just ultilize this library to carry out subjective analysis to obtain each new’s subjectivity score according to Title and full-text. Subjectivity scores are values within the range [0.0, 1.0], where 0.0 is very objective and 1.0 is very subjective.
3.5 Oil price trends with CNN
3.5.1 Introduction
In this subsection, we employs a CNN interface from the library, _PyTorch_, for implementing the prescribed network architecture of Zhang and Wallace’s (2017) CNN model. This approach is developed specifically for the sentiment analysis of short text.
Note: The CNN model begins with a tokenized sentence which is then converted to a sentence matrix, the rows of which are word vector representations of each token. We treat the sentence matrix as an ‘image’, and perform convolution on it via linear filters. The dimensionality of the feature map generated by each filter will vary as a function of the sentence length and the filter region size. Thus, a pooling function is applied to each feature map to induce a fixed-length vector. A common strategy is 1-max pooling (Boureau, Ponce, & LeCun, 2010), which extracts a scalar from each feature map. Together, the outputs generated from the filter maps can be concatenated into a fixed-length, ‘top-level’ feature vector, which is then fed through a softmax function to generate the final classification.
The advantage of the CNN classifier is based on multi-layer networks and convolution architecture. Since convolutional layers of CNNs apply a convolution operation to the input matrix, they are able to compose different semantic fragments of sentences and learn the interactions between composed fragments, thereby fully exploiting inter-modal semantic relations of crude oil news. Price movements either up or down within the transaction day are used as the output of the CNN classification.
The outputs of the CNN classification represent the fluctuation of daily crude oil prices, either increase or decrease. Specifically, the price movement $M_t$ is defined as:
Where, $p_t$ denotes the oil price at the end of day $t$.
In this way, the CNN model is trained to learn hidden patterns embedded within news headlines that affect the oil price. to improve our understanding of the CNN algorithm. The procedures are described as follows:
Step 1: Data preprocessing. The dataset is divided into training data (2011.08.01 - 2018.07.31) and testing data (2018.08.01 - 2021.07.31).
Step 2: Text vectorization. Convert news text to word vector with pretrainded word embedding. In this research, we utlize an unsupervised learning algorithm for word representation call GloVe (Pennington et al., 2014) proposed by Stanford University and is a new global log-bilinear regression model that aims to combine the advantages of the global matrix and local context window methods.
Word embedding is a dimension reduction technique that maps high-dimensional words (unstructured information) to low-dimensional numerical vectors (structured information). In other words, word embedding aims to convert documents into mathematical representations as computer-readable input and thus is essential for text analysis problems (Bai et al.).
Step 3: Train CNN model using the training sample. Word vector is feed into CNN model. The process of CNN model includes “Convolutional operation,” “Max Pooling,” and “Softmax classification”. A concise and complete flowchart is shown in Fig. 4.
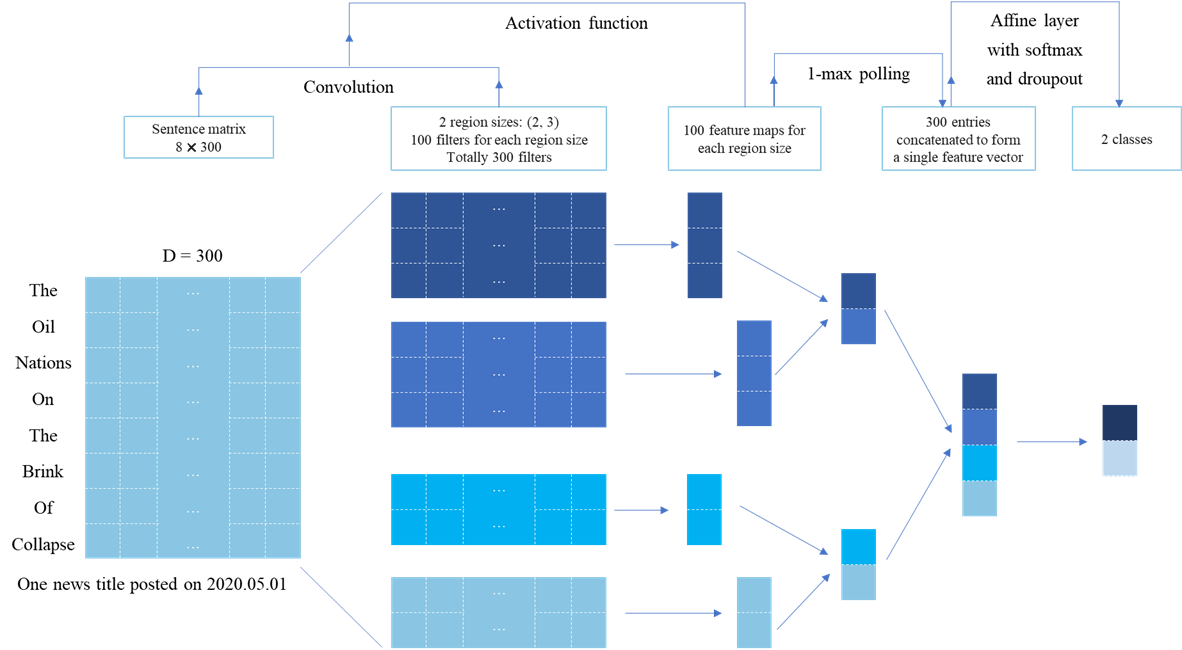
Fig.4 The flowchart of CNN model Step 3: Using the best trained CNN model classifies the test sample.
In this study, CNN is coded by Python 3.8. We employ a Python library, PyTorch, which provides convenient APIs for building Deep learning network.
3.5.2 Code implementation
Prepare data
- Import modelus
Load data
Examples for news data and oil price movement, see Table 5:
Table 5 Examples for news and oil price movement Date Movement Title 0 2011-08-01 -1.0 Debt Ceiling Agreement Pushes Crude Oil Prices Higher. Biofuels and Tequila: Agave May Make a Suitable Ethanol Crop. Jesters, Economics, and American Dollar Supremacy. Natural Gas Analysis for the Week of August 1, 2011. The Quiet Revolution: Latin America Moving Away from Washingtons Influence Spilt data into train/valid test
Generate dataset
Examples for built dataset.
1
2
3
4
5
6
7
8
9
10
11
12
13
14
15{'text': ['The', 'Death', 'of', 'the', 'Bond', 'Vigilantes', '.', 'Promising',
'Economic', 'and', 'Environmental', 'Developments', 'in', 'Oil', 'Sands',
'Production', '.', 'Are', 'High', 'Fuel', 'Taxes', 'the', 'Answer', 'to',
'Solving', 'our', 'Energy', 'Problems', '?', '.', 'Oil', 'and', 'Misinformation',
':', 'The', 'Truth', 'about', 'Oil', 'Companies', '.', 'Arab', 'Spring', 'Roils',
'Israel', "'s", 'Energy', 'Imports', '-', 'and', 'Israel'], 'label': '-1.0'}
{'text': ['Is', 'A', 'Supply', 'Crunch', 'In', 'Oil', 'Markets', 'Inevitable',
'?', '.', 'China', 'Sets', 'Up', 'EV', 'Battery', 'Recycling', 'Scheme', '.',
'U.S.', 'Military', 'Bases', 'In', 'Europe', 'Depend', 'On', 'Russian', 'Energy',
'.', 'Russias', 'High', 'Risk', 'Global', 'Oil', 'Strategy', '.', 'Oil', 'Prices',
'Fall', 'After', 'EIA', 'Confirms', 'Crude', 'Inventory', 'Build', '.', 'Exxons',
'Shocking', 'Supply', 'And', 'Demand', 'Predictions', '.', 'Was', 'The', 'Aramco',
'IPO', 'Destined', 'To', 'Fail', '?', '.', 'Kuwait', 'Oil', 'Production', 'Hits',
'18-Month', 'High', '.', 'U.S.', 'Oil', 'Production', 'Is', 'nt', 'Growing', 'As',
'Fast', 'As', 'Expected'], 'label': '-1.0'}
Build vocabulary and iterator
vocabulary size is 11023. And an example:
torch.Size([4, 125]) Oil Prices At Risk Of Economic Downturn . Oil Sector Under Fire In Libyan Corruption Crackdown . Houston To Overtake Cushing As Key Hub . Oil Prices Slip As OPEC+ Compliance Falls To 120 Percent In June . Is This The Next Global Leader In Ride Hailing Services ? . China Just Doubled Oil Shipments To North Korea . Has The Movement For CO2 Controls Peaked ? . Iran Files Complaint Against U.S. For Unlawful Sanctions . Oil Prices Rebound As Saudis Expect Reduced Exports In August <pad> <pad> <pad> <pad> <pad> <pad> <pad> <pad> <pad> <pad> <pad> <pad> <pad> <pad> <pad> <pad> <pad> <pad> <pad> <pad> <pad> <pad> <pad> <pad> <pad> <pad> <pad> <pad> <pad> <pad> <pad> <pad> <pad> <pad> <pad> <pad> <pad> <pad> 1.0The top 20 of most frequents:
1
2
3
4
5[('.', 21723), ('Oil', 10901), ('The', 6349), ('To', 4153), ('?', 3750),
('In', 3002), ('Is', 2705), ('Energy', 2585), ('Prices', 2342), ('For', 2230),
('A', 2119), ('U.S.', 1919), (':', 1864), ('Of', 1840), ('Gas', 1714),
('On', 1697), ('-', 1629), (',', 1474), ('the', 1422), ('As', 1395)]
[('1.0', 1310), ('-1.0', 1207)]
Model specification
- Model definition
- Creat CNN model
- Define metrics
- Train and evaluation
Predict with trained model
Full-sample evaluation
Loss:0.53
Accuracy:0.83

Classification Report:
              precision    recall  f1-score   support

         0.0       0.91      0.70      0.79      1207
         1.0       0.77      0.94      0.85      1310

    accuracy                           0.83      2517
   macro avg       0.84      0.82      0.82      2517
weighted avg       0.84      0.83      0.82      2517
Out-of-sample evaluation (test dataset)
Loss:0.58
Accuracy:0.58

Classification Report:
              precision    recall  f1-score   support

         0.0       0.58      0.28      0.38       352
         1.0       0.58      0.83      0.68       418

    accuracy                           0.58       770
   macro avg       0.58      0.55      0.53       770
weighted avg       0.58      0.58      0.54       770
Examples of trends
Date
2011-08-02    0.475409
2011-08-01    0.533262
2011-08-01    0.426512
2011-08-01    0.278523
2011-08-01    0.662444
Name: Title, dtype: float64
Examples of titles
Date
2014-11-28           Global Energy Advisory  28th November 2014
2016-02-16       UAE Offers India Free Oil To Ease Storage Woes
2017-10-09    Oil Stable After OPEC Chief Suggests Extraordi...
2019-09-17                          Why Oil Prices Just Fell 6%
2020-05-01             The Oil Nations On The Brink Of Collapse
Name: Title, dtype: object
View all data (Table 6)
Table 6 All processed data <thead> <tr style="text-align: right;"> <th></th> <th>Date</th> <th>Movement</th> <th>Title</th> <th>Prediction</th> </tr> </thead> <tbody> <tr> <th>0</th> <td>2011-08-01</td> <td>0.0</td> <td>Debt Ceiling Agreement Pushes Crude Oil Prices...</td> <td>0.415019</td> </tr> <tr> <th>1</th> <td>2011-08-02</td> <td>0.0</td> <td>The Death of the Bond Vigilantes. Promising Ec...</td> <td>0.247126</td> </tr> <tr> <th>2</th> <td>2011-08-03</td> <td>0.0</td> <td>What the Markets Are Telling Us. Putin Calls U...</td> <td>0.304862</td> </tr> <tr> <th>3</th> <td>2011-08-04</td> <td>0.0</td> <td>China's Rare Earth Industry Coming under Great...</td> <td>0.251284</td> </tr> <tr> <th>4</th> <td>2011-08-05</td> <td>1.0</td> <td>Here is Where to Watch for the Turn. Why High ...</td> <td>0.777504</td> </tr> <tr> <th>...</th> <td>...</td> <td>...</td> <td>...</td> <td>...</td> </tr> <tr> <th>2512</th> <td>2021-07-26</td> <td>0.0</td> <td>Can Iran Avoid A Major National Uprising?. Mid...</td> <td>0.375821</td> </tr> <tr> <th>2513</th> <td>2021-07-27</td> <td>0.0</td> <td>The EV Battery Conundrum: Commodity Rally Coul...</td> <td>0.409420</td> </tr> <tr> <th>2514</th> <td>2021-07-28</td> <td>1.0</td> <td>The Best Risk-Reward Plays In Oil. 5 Reasons W...</td> <td>0.462076</td> </tr> <tr> <th>2515</th> <td>2021-07-29</td> <td>1.0</td> <td>Shrinking Global Populations Poses An Existent...</td> <td>0.644484</td> </tr> <tr> <th>2516</th> <td>2021-07-30</td> <td>1.0</td> <td>Is Americas Oil Industry Too Big To Fail?. Net...</td> <td>0.659020</td> </tr> </tbody></table>
2517 rows × 4 columns
3.6 LDA topic model
3.6.1 Introduction
Referring to Li et al., We also apply the Latent Dirichlet Allocation (LDA) modelling approach of Blei, Ng, and Jordan (2003) in order to identify latent topics embedded within the news headlines corpus. We mainly adopt two Python library, OCITS and gensim, for implementing the LDA model.
The LDA model is based on the assumption that each document is a mixture of various topics, and each topic has a corresponding probability distribution for different words. Each document $d$ is viewed as a multinomial distribution $\theta (d)$ over $T$ topics, and each topic $z_j$, $j = 1 \dots T$, is assumed to have a multinomial distribution $\phi (j)$ over the set of words $W$. In order to uncover both the topics that are present and the distribution of these topics in each document from a corpus of documents, $D$, estimates of $\theta$ and $\phi$ are required.
Previously, topic models are usually compared by fixing their hyperparameters. However, Terragni et al. points out that choosing the optimal hyperparameter configuration for given dataset and a given evaluation metrics is fundamental to induce each model at the best of its capabilities, and therefore to gurantee a fair comparison with othr models. Therefore, to select a optimal topic number for topic modelling, we employ a unified and open-source evaluation framework, OCTIS for comparing Topic Models, whose optimal hyper-parameters configuration can be determined according to Bayesian Optimization strategy (Archetti and Candelieri, 2019; Snoek et al., 2012; Galuzzi et al., 2020). The Kullback–Leibler (KL) divergence approach was used to determine the topic number $T$. The results see Table 6.
Table 6 Topic_KL divergence of topic numbers, ranging from 2 to 19. Number of topics 2 3 4 5 6 7 8 9 10 Topic_KL divergence 0.8879 1.0784 1.0139 1.0088 0.9177 0.7942 0.7695 0.7423 0.627 Number of topics 11 12 13 14 15 16 17 18 19 Topic_KL divergence 0.5637 0.5432 0.5194 0.4878 0.5022 0.434 0.3936 0.3899 0.4147 It can be see that the maximum KL divergence metric value is 1.0139, where the number of topic is 4. Therefore, we believe that the optimal number of topics for LDA model is 4. For each topic during each transaction day, we compute average scores for the results of the sentimentanalysis and CNN classifications, to form sentiment-topic features and CNN-topic features.
These topic features are defined as follows:
Sentiment-topic score of topic $k$ on day $t$:
Polarity-topic score of topic $k$ on day $t$:
Subjectivity-topic score of topic $k$ on day $t$:
CNN-topic score of topic $k$ on day $t$:
Where $n_{k, t}$ is the total number of news headlines (or full-text) from topic $k$ on day $t$, $SE_{k,t}$ is the investor sentiment (including postive, negative and neutral) of news headline (or full-text) $i$ belonging to topic $k$ on day $t$. $P_i$, $SU_i$ are the polarity score and subjectivity score of news headline (or full-text) $i$ belonging to topic $k$ on day $t$, respectively.
3.6.2 Code implementation
Configurations
- Import moduls
- Stopwords
- Load data
- Load dataset
- Build vocabulary (vocab size: 7653)
Choosing the optimal topic numbers with OCTIS
Calculate KL_divergences, see Table 7:
Table 7 KL_divergences for different numbers of topic models 0 1 2 3 4 5 6 0 Number of topics 2 3 4 5 6 7 1 Topic_KL divergence 0.8879 1.0784 1.0139 1.0088 0.9177 0.7942 2 Number of topics 8 9 10 11 12 13 3 Topic_KL divergence 0.7695 0.7423 0.627 0.5637 0.5432 0.5194 4 Number of topics 14 15 16 17 18 19 5 Topic_KL divergence 0.4878 0.5022 0.434 0.3936 0.3899 0.4147 Conclusion: It can be see that the maximum KL divergence metric value is 1.0139, where the number of topic is 4. Therefore, we believe that the optimal number of topics for LDA model is 4.
Topic modelling with gensim
- Participle
Lemmatization
Results see Table 8:
Table 8 An example of news after lemmatizing
 <tr style="text-align: right;">
   <th></th>
   <th>Date</th>
   <th>Price</th>
   <th>Movement</th>
   <th>Title</th>
   <th>Time</th>
   <th>Trends</th>
   <th>Title_senti</th>
   <th>Title_Prediction</th>
   <th>Title_Pos</th>
   <th>Title_Neg</th>
   <th>...</th>
   <th>Content_Pos</th>
   <th>Content_Neg</th>
   <th>Content_Neutral</th>
   <th>Polarity_score</th>
   <th>Subjectivity_score</th>
   <th>Content_Polarity_score</th>
   <th>Content_Subjectivity_score</th>
   <th>Title_tokenize</th>
   <th>Title_tokenize_list</th>
   <th>Lemmatization</th>
 </tr>
</thead>
 <tr>
   <th>0</th>
   <td>8/2/2011</td>
   <td>93.79</td>
   <td>0</td>
   <td>The Death of the Bond Vigilantes</td>
   <td>8/1/2011 18:00</td>
   <td>0.475409</td>
   <td>-0.453832</td>
   <td>negative</td>
   <td>0.036499</td>
   <td>0.490331</td>
   <td>...</td>
   <td>0.036499</td>
   <td>0.490331</td>
   <td>0.47317</td>
   <td>0.0</td>
   <td>0.0</td>
   <td>0.006143</td>
   <td>0.469498</td>
   <td>The Death of the Bond Vigilantes</td>
   <td>[The, Death, of, the, Bond, Vigilantes]</td>
   <td>[Death, Bond, Vigilantes]</td>
 </tr>
</tbody>
</table>Shape: 1 rows × 23 columns
Remove stopwords (see Table 9)
Table 9 5 examples of news after removing stopwords
 <tr style="text-align: right;">
   <th></th>
   <th>Date</th>
   <th>Price</th>
   <th>Movement</th>
   <th>Title</th>
   <th>Time</th>
   <th>Trends</th>
   <th>Title_senti</th>
   <th>Title_Prediction</th>
   <th>Title_Pos</th>
   <th>Title_Neg</th>
   <th>...</th>
   <th>Content_Neg</th>
   <th>Content_Neutral</th>
   <th>Polarity_score</th>
   <th>Subjectivity_score</th>
   <th>Content_Polarity_score</th>
   <th>Content_Subjectivity_score</th>
   <th>Title_tokenize</th>
   <th>Title_tokenize_list</th>
   <th>Lemmatization</th>
   <th>Lemma_stopwords</th>
 </tr>
</thead>
 <tr>
   <th>0</th>
   <td>8/2/2011</td>
   <td>93.79</td>
   <td>0</td>
   <td>The Death of the Bond Vigilantes</td>
   <td>8/1/2011 18:00</td>
   <td>0.475409</td>
   <td>-0.453832</td>
   <td>negative</td>
   <td>0.036499</td>
   <td>0.490331</td>
   <td>...</td>
   <td>0.490331</td>
   <td>0.473170</td>
   <td>0.000</td>
   <td>0.00</td>
   <td>0.006143</td>
   <td>0.469498</td>
   <td>The Death of the Bond Vigilantes</td>
   <td>[The, Death, of, the, Bond, Vigilantes]</td>
   <td>[Death, Bond, Vigilantes]</td>
   <td>[Death, Bond, Vigilantes]</td>
 </tr>
 <tr>
   <th>1</th>
   <td>8/1/2011</td>
   <td>94.89</td>
   <td>0</td>
   <td>Debt Ceiling Agreement Pushes Crude Oil Prices...</td>
   <td>8/1/2011 08:50</td>
   <td>0.533262</td>
   <td>-0.865410</td>
   <td>negative</td>
   <td>0.050545</td>
   <td>0.915956</td>
   <td>...</td>
   <td>0.915956</td>
   <td>0.033499</td>
   <td>-0.225</td>
   <td>0.75</td>
   <td>-0.025652</td>
   <td>0.416797</td>
   <td>Debt Ceiling Agreement Pushes Crude Oil Prices...</td>
   <td>[Debt, Ceiling, Agreement, Pushes, Crude, Oil,...</td>
   <td>[Debt, Ceiling, Agreement, push, Crude, Oil, p...</td>
   <td>[Debt, Ceiling, Agreement, push, Crude, price,...</td>
 </tr>
 <tr>
   <th>2</th>
   <td>8/1/2011</td>
   <td>94.89</td>
   <td>0</td>
   <td>Biofuels and Tequila: Agave May Make a Suitabl...</td>
   <td>8/1/2011 07:12</td>
   <td>0.426512</td>
   <td>0.309331</td>
   <td>neutral</td>
   <td>0.316535</td>
   <td>0.007204</td>
   <td>...</td>
   <td>0.007204</td>
   <td>0.676260</td>
   <td>0.550</td>
   <td>0.75</td>
   <td>0.150435</td>
   <td>0.560072</td>
   <td>Biofuels and Tequila : Agave May Make a Suitab...</td>
   <td>[Biofuels, and, Tequila, :, Agave, May, Make, ...</td>
   <td>[Biofuels, Tequila, Agave, May, make, suitable...</td>
   <td>[Biofuels, Tequila, Agave, May, make, suitable...</td>
 </tr>
 <tr>
   <th>3</th>
   <td>8/1/2011</td>
   <td>94.89</td>
   <td>0</td>
   <td>Jesters, Economics, and American Dollar Supremacy</td>
   <td>8/1/2011 07:18</td>
   <td>0.278523</td>
   <td>0.001767</td>
   <td>neutral</td>
   <td>0.038573</td>
   <td>0.036806</td>
   <td>...</td>
   <td>0.036806</td>
   <td>0.924621</td>
   <td>0.000</td>
   <td>0.00</td>
   <td>0.056149</td>
   <td>0.392723</td>
   <td>Jesters , Economics , and American Dollar Supr...</td>
   <td>[Jesters, ,, Economics, ,, and, American, Doll...</td>
   <td>[Jesters, Economics, American, Dollar, Supremacy]</td>
   <td>[Jesters, Economics, American, Dollar, Supremacy]</td>
 </tr>
 <tr>
   <th>4</th>
   <td>8/1/2011</td>
   <td>94.89</td>
   <td>0</td>
   <td>Natural Gas Analysis for the Week of August 1,...</td>
   <td>8/1/2011 07:15</td>
   <td>0.662444</td>
   <td>-0.032567</td>
   <td>neutral</td>
   <td>0.020734</td>
   <td>0.053301</td>
   <td>...</td>
   <td>0.053301</td>
   <td>0.925965</td>
   <td>0.100</td>
   <td>0.40</td>
   <td>0.099722</td>
   <td>0.475185</td>
   <td>Natural Gas Analysis for the Week of August 1 ...</td>
   <td>[Natural, Gas, Analysis, for, the, Week, of, A...</td>
   <td>[Natural, Gas, Analysis, Week, August]</td>
   <td>[Natural, Gas, Analysis, Week, August]</td>
 </tr>
</tbody>
</table>Shape: 5 rows × 24 columns
Build the bigram
Table 10 5 examples of news after bigram processing
 <tr style="text-align: right;">
   <th></th>
   <th>Date</th>
   <th>Price</th>
   <th>Movement</th>
   <th>Title</th>
   <th>Time</th>
   <th>Trends</th>
   <th>Title_senti</th>
   <th>Title_Prediction</th>
   <th>Title_Pos</th>
   <th>Title_Neg</th>
   <th>...</th>
   <th>Polarity_score</th>
   <th>Subjectivity_score</th>
   <th>Content_Polarity_score</th>
   <th>Content_Subjectivity_score</th>
   <th>Title_tokenize</th>
   <th>Title_tokenize_list</th>
   <th>Lemmatization</th>
   <th>Lemma_stopwords</th>
   <th>Bigrams</th>
   <th>Trigrams</th>
 </tr>
</thead>
 <tr>
   <th>24037</th>
   <td>7/1/2021</td>
   <td>75.23</td>
   <td>1</td>
   <td>Iraq Uses Controversial Oil Deal To Secure Fun...</td>
   <td>6/30/2021 18:00</td>
   <td>0.656656</td>
   <td>0.642171</td>
   <td>positive</td>
   <td>0.657396</td>
   <td>0.015225</td>
   <td>...</td>
   <td>0.475</td>
   <td>0.775</td>
   <td>0.037309</td>
   <td>0.361200</td>
   <td>Iraq Uses Controversial Oil Deal To Secure Fun...</td>
   <td>[Iraq, Uses, Controversial, Oil, Deal, To, Sec...</td>
   <td>[Iraq, use, Controversial, Oil, deal, secure, ...</td>
   <td>[Iraq, use, Controversial, deal, secure, fundi...</td>
   <td>[Iraq, use, Controversial, deal, secure, fundi...</td>
   <td>[Iraq, use, Controversial, deal, secure, fundi...</td>
 </tr>
 <tr>
   <th>8990</th>
   <td>7/5/2016</td>
   <td>46.60</td>
   <td>0</td>
   <td>U.S. Sees Largest Monthly Production Decline S...</td>
   <td>7/2/2016 08:27</td>
   <td>0.475362</td>
   <td>-0.964390</td>
   <td>negative</td>
   <td>0.007528</td>
   <td>0.971918</td>
   <td>...</td>
   <td>0.000</td>
   <td>0.000</td>
   <td>0.147672</td>
   <td>0.551499</td>
   <td>U.S. Sees Largest Monthly Production Decline S...</td>
   <td>[U.S., Sees, Largest, Monthly, Production, Dec...</td>
   <td>[U.S., see, large, monthly, production, declin...</td>
   <td>[U.S., see, large, monthly, production, declin...</td>
   <td>[U.S., see, large, monthly, production, declin...</td>
   <td>[U.S., see, large, monthly, production, declin...</td>
 </tr>
 <tr>
   <th>14319</th>
   <td>5/7/2018</td>
   <td>70.73</td>
   <td>1</td>
   <td>Banking Giants To Choose Sides In Saudi-Qatar ...</td>
   <td>5/5/2018 16:00</td>
   <td>0.713667</td>
   <td>0.060967</td>
   <td>neutral</td>
   <td>0.080845</td>
   <td>0.019878</td>
   <td>...</td>
   <td>0.000</td>
   <td>0.000</td>
   <td>0.063642</td>
   <td>0.385634</td>
   <td>Banking Giants To Choose Sides In Saudi-Qatar ...</td>
   <td>[Banking, Giants, To, Choose, Sides, In, Saudi...</td>
   <td>[banking, giant, choose, side, Saudi, Qatar, R...</td>
   <td>[banking, giant, choose, side, Saudi, Qatar, R...</td>
   <td>[banking, giant, choose, side, Saudi, Qatar, R...</td>
   <td>[banking, giant, choose, side, Saudi, Qatar, R...</td>
 </tr>
 <tr>
   <th>24237</th>
   <td>7/22/2021</td>
   <td>71.91</td>
   <td>1</td>
   <td>China Taps Into Crude Reserves To Curb Oil Pri...</td>
   <td>7/22/2021 10:00</td>
   <td>0.778163</td>
   <td>0.539656</td>
   <td>positive</td>
   <td>0.599639</td>
   <td>0.059983</td>
   <td>...</td>
   <td>-0.700</td>
   <td>1.000</td>
   <td>-0.088148</td>
   <td>0.504259</td>
   <td>China Taps Into Crude Reserves To Curb Oil Pri...</td>
   <td>[China, Taps, Into, Crude, Reserves, To, Curb,...</td>
   <td>[China, tap, crude, reserve, Curb, Oil, Price,...</td>
   <td>[China, tap, crude, reserve, Curb, Price, Rally]</td>
   <td>[China, tap, crude, reserve, Curb, Price, Rally]</td>
   <td>[China, tap, crude, reserve, Curb, Price, Rally]</td>
 </tr>
 <tr>
   <th>22368</th>
   <td>12/17/2020</td>
   <td>48.36</td>
   <td>1</td>
   <td>An Under-The-Radar Opportunity In LNG</td>
   <td>12/17/2020 13:00</td>
   <td>0.293937</td>
   <td>0.543063</td>
   <td>positive</td>
   <td>0.559450</td>
   <td>0.016386</td>
   <td>...</td>
   <td>0.000</td>
   <td>0.000</td>
   <td>0.109774</td>
   <td>0.374197</td>
   <td>An Under-The-Radar Opportunity In LNG</td>
   <td>[An, Under-The-Radar, Opportunity, In, LNG]</td>
   <td>[radar, opportunity, LNG]</td>
   <td>[radar, opportunity, LNG]</td>
   <td>[radar, opportunity, LNG]</td>
   <td>[radar, opportunity, LNG]</td>
 </tr>
</tbody>
</table>Shape: 5 rows × 26 columns
Creat dictionary (Word2id & id2word)
Build LDA model
We have determined the optimal topic_nums (4) with the help of
OCTISmodule. So we build a LDA model with 4 topics.Print topic information:
[(0,
  '0.070*"U.S." + 0.040*"Energy" + 0.019*"Saudi" + 0.019*"rise" + '
  '0.018*"Shale" + 0.015*"Crude" + 0.014*"Arabia" + 0.014*"become" + '
  '0.013*"New" + 0.012*"year"'),
 (1,
  '0.039*"demand" + 0.025*"China" + 0.019*"soar" + 0.018*"major" + '
  '0.016*"energy" + 0.013*"Russia" + 0.012*"cut" + 0.012*"Global" + '
  '0.011*"renewable" + 0.010*"large"'),
 (2,
  '0.032*"market" + 0.030*"big" + 0.020*"see" + 0.017*"production" + '
  '0.017*"stock" + 0.016*"gas" + 0.015*"Industry" + 0.014*"ev" + 0.011*"look" '
  '+ 0.011*"Boom"'),
 (3,
  '0.081*"price" + 0.029*"Gas" + 0.020*"OPEC" + 0.018*"Iran" + 0.017*"high" + '
  '0.016*"boom" + 0.015*"Rig" + 0.014*"Count" + 0.012*"Natural" + '
  '0.012*"fuel"')]
Topic infomation
View model imformation, see Table 11:
Table 11 Some samples of news and the topic they belong to Document_No Dominant_Topic Topic_Perc_Contrib Keywords Title 0 0 0 0.2679 U.S., Energy, Saudi, rise, Shale, Crude, Arabi... The Death of the Bond Vigilantes 1 1 0 0.2828 U.S., Energy, Saudi, rise, Shale, Crude, Arabi... Debt Ceiling Agreement Pushes Crude Oil Prices... 2 2 3 0.2836 price, Gas, OPEC, Iran, high, boom, Rig, Count... Biofuels and Tequila: Agave May Make a Suitabl... 3 3 0 0.2724 U.S., Energy, Saudi, rise, Shale, Crude, Arabi... Jesters, Economics, and American Dollar Supremacy 4 4 0 0.2646 U.S., Energy, Saudi, rise, Shale, Crude, Arabi... Natural Gas Analysis for the Week of August 1,... 5 5 3 0.2902 price, Gas, OPEC, Iran, high, boom, Rig, Count... The Quiet Revolution: Latin America Moving Awa... 6 6 2 0.2600 market, big, see, production, stock, gas, Indu... Promising Economic and Environmental Developme... 7 7 3 0.2629 price, Gas, OPEC, Iran, high, boom, Rig, Count... Are High Fuel Taxes the Answer to Solving our ... 8 8 0 0.2719 U.S., Energy, Saudi, rise, Shale, Crude, Arabi... Oil and Misinformation: The Truth about Oil Co... 9 9 0 0.2545 U.S., Energy, Saudi, rise, Shale, Crude, Arabi... Arab Spring Roils Israel's Energy Imports - an... Where,
- Document_No: The id for title;
- Dominant_Topic: The topic to which this title most likely belongs
- Topic_Perc_Contrib: The probability of being classified under this topic
- Keywords: the keywords of the topic
- Text: The title’s content after participle
Extract information, see Table 12:
Table 12 Concatenated table with all features
<tr style="text-align: right;">
  <th></th>
  <th>Date</th>
  <th>Price</th>
  <th>Movement</th>
  <th>Title</th>
  <th>Time</th>
  <th>Trends</th>
  <th>Title_senti</th>
  <th>Title_Prediction</th>
  <th>Title_Pos</th>
  <th>Title_Neg</th>
  <th>...</th>
  <th>Content_Subjectivity_score</th>
  <th>Title_tokenize</th>
  <th>Title_tokenize_list</th>
  <th>Lemmatization</th>
  <th>Lemma_stopwords</th>
  <th>Bigrams</th>
  <th>Trigrams</th>
  <th>Dominant_Topic</th>
  <th>Topic_Perc_Contrib</th>
  <th>Keywords</th>
</tr>
</thead>
<tr>
  <th>0</th>
  <td>8/2/2011</td>
  <td>93.79</td>
  <td>0</td>
  <td>The Death of the Bond Vigilantes</td>
  <td>8/1/2011 18:00</td>
  <td>0.475409</td>
  <td>-0.453832</td>
  <td>negative</td>
  <td>0.036499</td>
  <td>0.490331</td>
  <td>...</td>
  <td>0.469498</td>
  <td>The Death of the Bond Vigilantes</td>
  <td>[The, Death, of, the, Bond, Vigilantes]</td>
  <td>[Death, Bond, Vigilantes]</td>
  <td>[Death, Bond, Vigilantes]</td>
  <td>[Death, Bond, Vigilantes]</td>
  <td>[Death, Bond, Vigilantes]</td>
  <td>0</td>
  <td>0.2679</td>
  <td>U.S., Energy, Saudi, rise, Shale, Crude, Arabi...</td>
</tr>
<tr>
  <th>1</th>
  <td>8/1/2011</td>
  <td>94.89</td>
  <td>0</td>
  <td>Debt Ceiling Agreement Pushes Crude Oil Prices...</td>
  <td>8/1/2011 08:50</td>
  <td>0.533262</td>
  <td>-0.865410</td>
  <td>negative</td>
  <td>0.050545</td>
  <td>0.915956</td>
  <td>...</td>
  <td>0.416797</td>
  <td>Debt Ceiling Agreement Pushes Crude Oil Prices...</td>
  <td>[Debt, Ceiling, Agreement, Pushes, Crude, Oil,...</td>
  <td>[Debt, Ceiling, Agreement, Pushes, Crude, Oil,...</td>
  <td>[Debt, Ceiling, Agreement, Pushes, Crude, pric...</td>
  <td>[Debt, Ceiling, Agreement, Pushes, Crude, pric...</td>
  <td>[Debt, Ceiling, Agreement, Pushes, Crude, pric...</td>
  <td>0</td>
  <td>0.2828</td>
  <td>U.S., Energy, Saudi, rise, Shale, Crude, Arabi...</td>
</tr>
<tr>
  <th>2</th>
  <td>8/1/2011</td>
  <td>94.89</td>
  <td>0</td>
  <td>Biofuels and Tequila: Agave May Make a Suitabl...</td>
  <td>8/1/2011 07:12</td>
  <td>0.426512</td>
  <td>0.309331</td>
  <td>neutral</td>
  <td>0.316535</td>
  <td>0.007204</td>
  <td>...</td>
  <td>0.560072</td>
  <td>Biofuels and Tequila : Agave May Make a Suitab...</td>
  <td>[Biofuels, and, Tequila, :, Agave, May, Make, ...</td>
  <td>[biofuel, Tequila, Agave, make, suitable, etha...</td>
  <td>[biofuel, Tequila, Agave, make, suitable, etha...</td>
  <td>[biofuel, Tequila, Agave, make, suitable, etha...</td>
  <td>[biofuel, Tequila, Agave, make, suitable, etha...</td>
  <td>3</td>
  <td>0.2836</td>
  <td>price, Gas, OPEC, Iran, high, boom, Rig, Count...</td>
</tr>
<tr>
  <th>3</th>
  <td>8/1/2011</td>
  <td>94.89</td>
  <td>0</td>
  <td>Jesters, Economics, and American Dollar Supremacy</td>
  <td>8/1/2011 07:18</td>
  <td>0.278523</td>
  <td>0.001767</td>
  <td>neutral</td>
  <td>0.038573</td>
  <td>0.036806</td>
  <td>...</td>
  <td>0.392723</td>
  <td>Jesters , Economics , and American Dollar Supr...</td>
  <td>[Jesters, ,, Economics, ,, and, American, Doll...</td>
  <td>[Jesters, Economics, American, Dollar, Supremacy]</td>
  <td>[Jesters, Economics, American, Dollar, Supremacy]</td>
  <td>[Jesters, Economics, American, Dollar, Supremacy]</td>
  <td>[Jesters, Economics, American, Dollar, Supremacy]</td>
  <td>0</td>
  <td>0.2724</td>
  <td>U.S., Energy, Saudi, rise, Shale, Crude, Arabi...</td>
</tr>
<tr>
  <th>4</th>
  <td>8/1/2011</td>
  <td>94.89</td>
  <td>0</td>
  <td>Natural Gas Analysis for the Week of August 1,...</td>
  <td>8/1/2011 07:15</td>
  <td>0.662444</td>
  <td>-0.032567</td>
  <td>neutral</td>
  <td>0.020734</td>
  <td>0.053301</td>
  <td>...</td>
  <td>0.475185</td>
  <td>Natural Gas Analysis for the Week of August 1 ...</td>
  <td>[Natural, Gas, Analysis, for, the, Week, of, A...</td>
  <td>[Natural, Gas, Analysis, Week, August]</td>
  <td>[Natural, Gas, Analysis, Week, August]</td>
  <td>[Natural, Gas, Analysis, Week, August]</td>
  <td>[Natural, Gas, Analysis, Week, August]</td>
  <td>0</td>
  <td>0.2646</td>
  <td>U.S., Energy, Saudi, rise, Shale, Crude, Arabi...</td>
</tr>
</tbody>
</table>Shape: 5 rows × 29 columns
Find the most representative document for each topic
Table 13 The most two representative document for each topic Topic_Num Topic_Perc_Contrib Keywords Title 0 0.0 0.3072 U.S., Energy, Saudi, rise, Shale, Crude, Arabi... U.S. Growth Fears Push Crude Oil Futures Close... 1 0.0 0.2951 U.S., Energy, Saudi, rise, Shale, Crude, Arabi... Britain Opens its First Public Hydrogen Fillin... 2 1.0 0.2895 demand, China, soar, major, energy, Russia, cu... UK's Largest Coal Power Plant to be Converted ... 3 1.0 0.2892 demand, China, soar, major, energy, Russia, cu... Russia And Saudi Arabia Consider Even Deeper O... 4 2.0 0.2874 market, big, see, production, stock, gas, Indu... Energy Storage Tech Finally Starting To Compet... 5 2.0 0.2840 market, big, see, production, stock, gas, Indu... Is The Bottom Finally In Sight For U.S. Drilli... 6 3.0 0.2920 price, Gas, OPEC, Iran, high, boom, Rig, Count... New Pipeline from Kurdistan to Turkey Poses Ri... 7 3.0 0.2902 price, Gas, OPEC, Iran, high, boom, Rig, Count... The Quiet Revolution: Latin America Moving Awa... Topic distribution across documents, see Table 13:
Table 13 Topic distribution across documents Dominant_Topic Topic_Keywords Num_Documents Perc_Documents 0 0.0 U.S., Energy, Saudi, rise, Shale, Crude, Arabi... 10673 0.4391 1 3.0 price, Gas, OPEC, Iran, high, boom, Rig, Count... 4010 0.1650 2 2.0 market, big, see, production, stock, gas, Indu... 4030 0.1658 3 1.0 demand, China, soar, major, energy, Russia, cu... 5595 0.2302 Evaluation
Compute the perplexity.
Perplexity: -11.663989584579646
Visualization
We can visualize the LDA model with the help of
pyLDAvismodule, a Python library, see Fig. 5.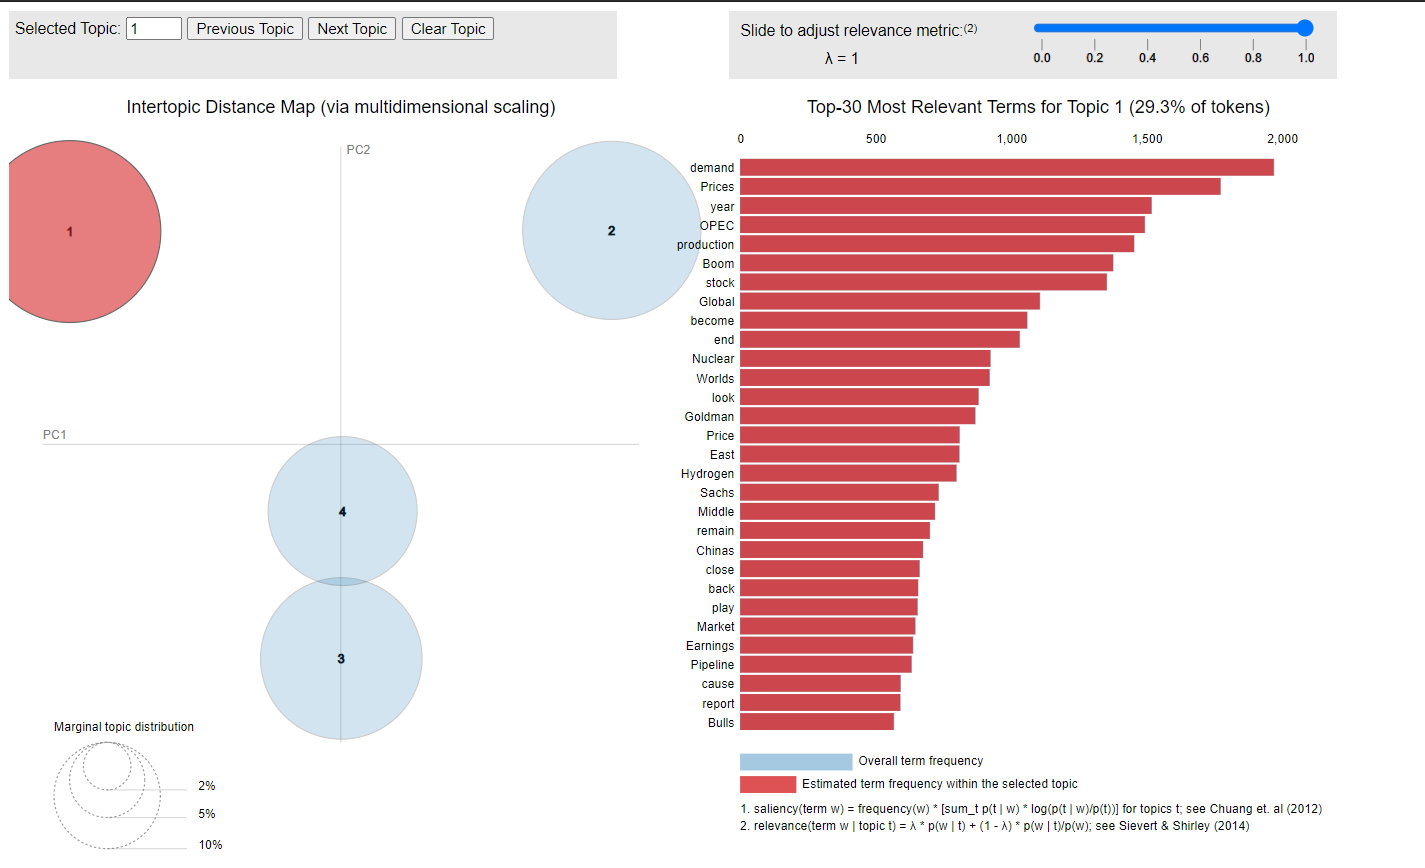
Fig.5 Visualization of LDA model -------------This blog is over! Thanks for your reading-------------- Post link: http://yangsuoly.com/2021/09/01/Text-mining/
